Half-life
Peptide half-life calculator
Type a half-life, how often a dose repeats, and how many doses. See an estimated curve of relative amount over time, built from the numbers you enter.
Half-life visualiser
Up to 20
Estimated amount, relative to one dose
A textbook first-order model on the values you enter — an estimate for understanding, not a measurement or a prediction for you. It is not dosing advice.
Published by Peptade · Half-life · Updated September 2026
This tool plots a textbook first-order decay curve from three numbers you provide: a half-life, an interval between doses, and a number of doses. It doesn't know what compound you're picturing — it's the same curve for any half-life you type, in hours or days.
It's built for understanding the shape of the curve — how a repeated schedule stacks up over time — not for predicting what's happening in any one person. Real absorption, distribution and clearance vary between people and don't match a textbook curve exactly.
An estimate from your own entries.
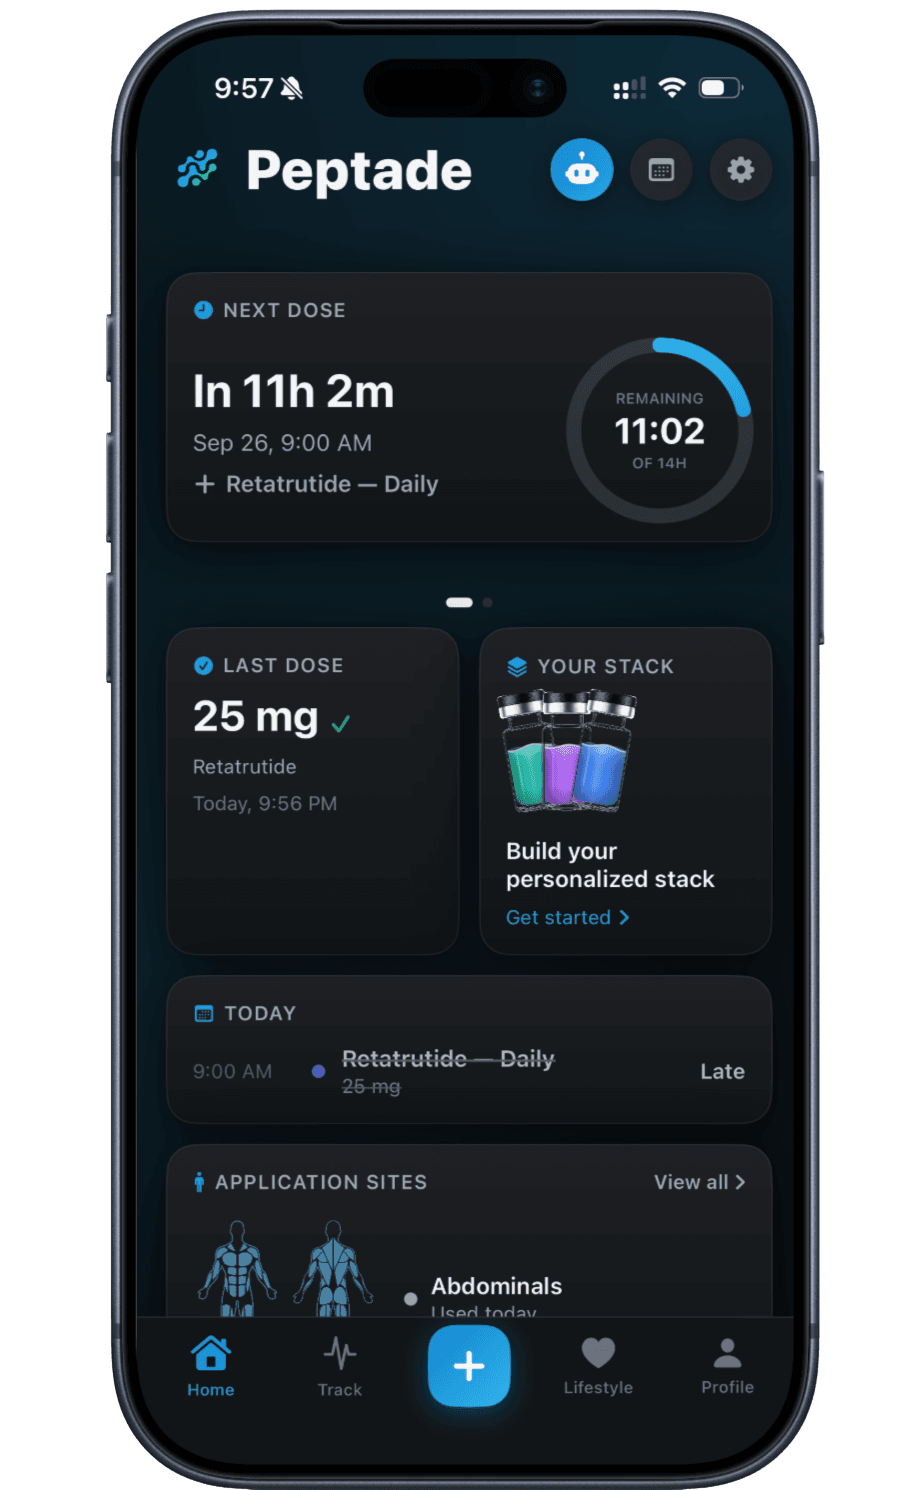
Peptade's medication-level chart uses the half-life values you enter for your compounds and the doses you log to estimate levels across your schedule.
- Saved per compound
- Schedules, cycles and titrations
- Supply that counts down
What a half-life is
A half-life is how long it takes for half of a given amount to clear, if clearance follows a steady, predictable pattern. It's a property of how something is processed, not of any one dose.
A short half-life clears in a matter of hours; a long one can take days. Either way the pattern has the same shape — it just plays out on a different timescale.
What "about N" means over time
Half-lives are usually reported as "about" a value, because the true rate varies somewhat between people and even between measurements in the same person. After one half-life, roughly half of a given amount remains; after two, about a quarter; after four, well under a tenth.
That's why the calculator's result is always framed as an estimate — it applies one steady rate uniformly, which real biology only approximates.
Repeated doses and steady state
When doses repeat before the previous one has fully cleared, the amounts add together. Early in a schedule, the peak after each dose climbs a little higher than the one before, because some of the prior dose is still present.
Eventually, in this model, what clears between doses comes to roughly match what's added, and the peak stops climbing — that's steady state. How many doses it takes to get there depends on how long the half-life is relative to how often doses repeat.
Why the chart is an estimate, not a measurement
The curve assumes instant absorption and one fixed clearance rate for every dose — a simplification that makes the shape easy to see, not a lab measurement of anything in your body.
Use it to understand the general pattern a schedule produces, not to judge how you personally are clearing anything. Peptade's medication-level feature charts a similar estimate from the half-life you enter for each of your own compounds, alongside the doses you log.
Frequently asked questions
A half-life in hours or days, the time between doses, and how many doses to plot, up to twenty. It has no built-in compound list.
No. It's a general first-order model applied to the numbers you typed — an illustration of the shape, not a measurement or a prediction for your body.
That's what a steady state looks like in this model: once what clears between doses roughly matches what's added, the peak stops climbing.
More free calculators
- Medication levelMedication Level: Estimated Half-Life CurveSee an estimated level curve for a compound, built from the half-life you enter and the doses you log — a visual model, not a measurement.
- CalculatorReconstitution calculatorConvert your vial amount, water and dose into concentration, syringe units and doses per compound — a free unit converter with no drug database or defaults.
- CalculatorPeptide vial supply calculatorWork out how many doses a vial holds and how many days it will last, from the vial amount, your dose and how often you dose — arithmetic, not a protocol.
Peptade is for tracking and education only. It is not medical advice, a diagnosis, or a prescription, and it does not tell you to take, start, stop or buy anything. See the Medical Disclaimer.